

Individual investors never seem very interested in their bond portfolio. Maybe it’s because bonds lack the sense of identity that often comes with owning a stock. Think about it: nobody brags out about lending money to Apple, they brag about owning Apple. In addition, you can theoretically own a company forever, whereas a loan has a set term.
Bonds also tend to be more difficult to understand for someone without a basic foundation of how they work. The purpose of this article is to break those barriers and introduce you to bond basics.
When you buy a bond, you are simply loaning the issuer (entity selling the bond) money. The issuer may be a government, corporation, federal agency, etc. In return for your money, the issuer promises to pay you a specific amount of interest (coupon) during the life of the bond and to repay the principal value of the bond at the end of the loan term (maturity).
Measuring Return On Your Bond Portfolio
The total return you receive by holding a bond until it matures is measured by yield to maturity, which equals all interest payments you receive until maturity as well as any gain or loss of principal. For example, consider a bond with the following characteristics.
- 10-year term
- $1,000 face value
- $80 annual interest payment
If you bought this bond at par (meaning you paid the face value), then the yield to maturity is 8.0%. If you bought the same bond at a discount of $900, then the yield to maturity is 9.6%. The increase in return is a result of buying the bond below its stated face value. It works the other way too, if you bought the bond at a premium of $1,100, then the yield to maturity is 6.6% and the decrease in return is a result of buying the bond above its stated face value.
Bond Prices and Interest Rate Changes
A common misconception is that bonds and bond funds are risk free, but they experience price volatility in response to various factors, the most prevalent being changes in market interest rates. As market interest rates rise, the prices of outstanding bonds with lower rates fall. Conversely, as interest rates fall, prices of outstanding bonds rise until their yield matches that of new bonds issued at the current rate. This relationship can be illustrated using a simplified yield calculation.
[The following example uses current yield rather than yield-to-maturity for the sake of simplicity.]
Imagine you own a $1,000 bond with an annual interest payment of $80, giving you a current yield of 8% ($80 / $1000 = 8%). If market interest rates rise to 9%, then your bond will decrease to roughly $888 ($80 / $888 = 9%). If market interest rates were to fall to 7%, the price of your bond would increase to $1142 ($80 / $1142 = 7%).
Of course, it isn’t quite that simple because a change in interest rates doesn’t affect all bonds equally. Duration measures how sensitive a bond’s price is to changes in interest rates. Duration may be too complicated at this juncture, so just know that higher duration bonds experience bigger gains and losses in response to a change in interest rates.
Drivers of Bond Performance: Term and Credit Risk
Moving on to performance, relative returns are largely driven by the term and credit quality of a bond Longer-term bonds experience bigger price movements for a given change in interest rates and, thus, investors expect to be compensated for taking that extra risk. Although longer-term bonds offer higher yields, they don’t necessarily offer enough of a return premium for individual investors to justify the higher risk when compared to short-term bonds.
Consider the table below of historical returns and volatility. As you can see, returns (represented by the blue bars) increase as the term of the bond increases. Because risk and return are related, you will also notice that volatility (represented by the orange bars) increase with term as well. However, the risk and return trade off becomes less attractive further out on the yield curve.
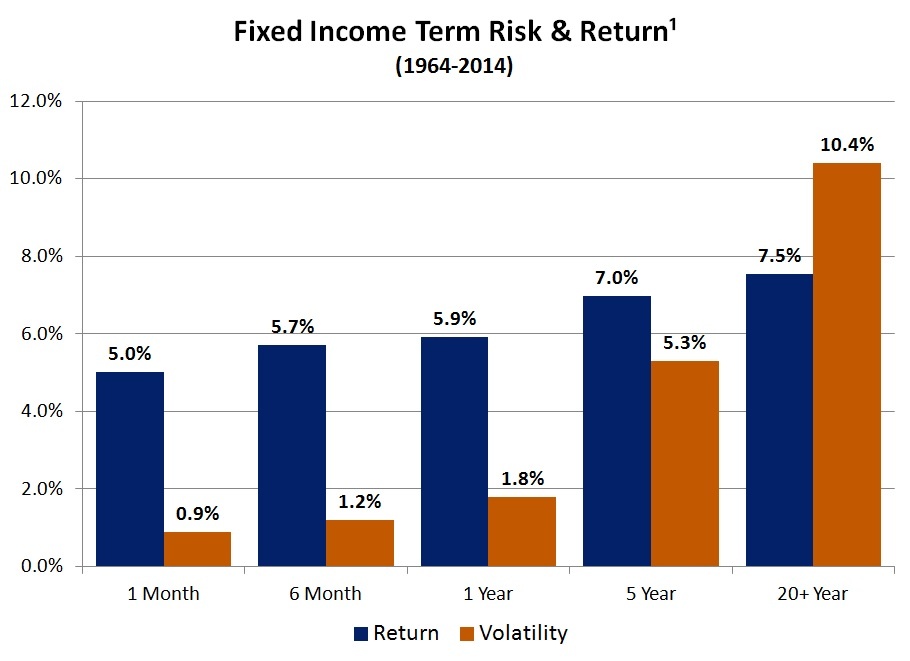
Ask yourself as an individual investor, is the little bit of extra return provided by a 20+ year bond versus shorter-term bonds really worth all of the extra volatility? 20+ Year bonds have only earned half a percentage point more than 5-Year bonds, but with twice the volatility. For most individual investors, the answer is no. Longer-term bonds are better suited for institutions seeking asset liability matching abilities such as pensions, banks, insurance companies, etc.
In addition to compensation for taking term risk, bond investors also receive additional compensation for assuming higher default risk, or the inability of a borrower to repay its debt.
By loaning money to a company with lower credit quality, investors face a higher risk of not receiving all of the promised interest and principal payments. In addition, lower rated bonds tend to drop more in value when the economy slows because recessions lead to lower profits and increase the likelihood of default. Consequently, investors require a higher yield to compensate them for taking the extra risk.
Credit rating firms such as Moody’s or Standard & Poor’s evaluate a borrower’s ability and willingness to repay its debts. Bonds rated AAA, AA, A, or BBB are considered investment grade, which means the issuer is likely to fulfill its debt obligations. Non-investment grade bonds, also referred to as high-yield or junk bonds, are rated BB or lower to indicate their higher probability of default.
The relationship between fixed income credit risk and historical returns in depicted below. The data set doesn’t have as long of a history, but you can still see how taking additional credit risk by lending to lower quality companies produces higher returns and higher volatility.
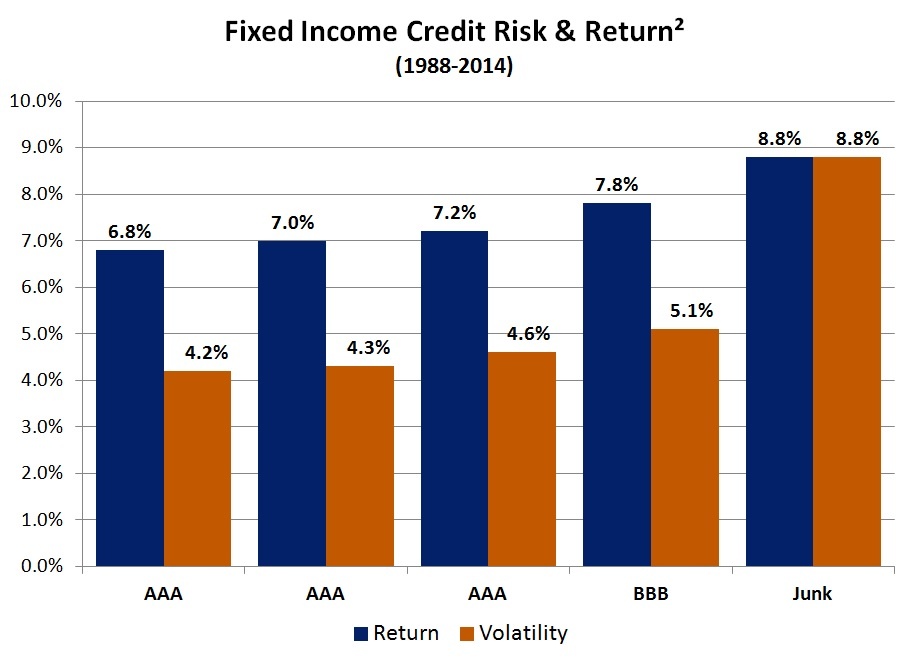
Much like our first example of term risk, credit risk is only beneficial to a certain point. For example, Junk bond returns are one percentage point higher than BBB bonds, but they come with 72% greater volatility!
So there you have it. Hopefully this provides a good base for future bond articles. Below are key concepts to remember.
Key terms and concepts:
- Maturity – The length of time until the loan contract (bond) expires.
- Par value – The amount the borrower promises to pay on or before the maturity date.
- Coupon rate – The interest rate that is multiplied by the par value of a bond to determine the amount of interest the borrower will pay annually.
- Interest rates and bond prices – Bond prices and interest rates have an inverse relationship. When interest rates rise, bond prices fall. When interest rates fall, bond prices rise.
- Duration – A measure of a bond’s sensitivity to changes in interest rates. A bond with a high duration will experience bigger gains or losses in response to a change in interest rates.
- Term risk – Bonds with a longer time until maturity offer higher yields, but are riskier.
- Credit risk – Bonds with lower credit quality offer higher yields, but are riskier.
Sources and Disclosures:
1. One-month, five-year, and 20+ Year data uses Ibbotson indices. Six-month and one-year data uses Bank of America Merrill Lynch Indices.
2.Bank of American Merrill Lynch index data from Federal Reserve Economic Data (FRED).
PAST PERFORMANCE IS NO GUARANTEE OF FUTURE RESULTS. Investing involves risk. It should not be assumed that recommendations made in the future will be profitable or will equal the performance shown. Investment returns and principal value of an investment will fluctuate and losses may occur. Diversification does not ensure a profit or guarantee against a loss.
This article originally appeared on Forbes.com.