

Valuation – the price you pay for earnings, assets minus liabilities, cash flow, etc – is one of the best indicators of future returns. In general, we experience lower returns when valuations are high (i.e. stocks are more expensive), and higher returns when valuations are low (stocks are cheaper).
The most well known valuation metric is the price-to-earnings (P/E) ratio, which measures how much investors pay for a dollar of a company’s earnings. As investors become more confident about the future, they are willing to pay more for a dollar of earnings.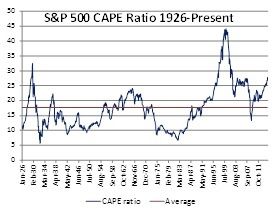
Consider that six years ago during the depths of the financial crisis, the S&P 500 had a P/E ratio of 11. This meant that investors were willing to pay $11 for a single dollar of S&P 500 earnings. Fast forward to today and confidence is much higher and, thus, investors are willing to pay more for stocks. The P/E ratio for the S&P 500 today is just over 17.
A variation of the simple P/E ratio is the cyclically adjusted price to earnings (CAPE) ratio. Instead of dividing price by the past 12 months of earnings as we do with the simple P/E ratio, the CAPE ratio divides price by the average earnings of the past ten years. The idea here is to smooth out the good and bad years created by business cycles. Today, the CAPE ratio is at 27, which is considered to be quite high.
When the market has been steadily climbing for such a long period of time, valuations tend to expand and it’s important to keep expectations in check. Valuation is a terrible timing tool, but it is useful in setting expectations about future returns.
The graphic below uses monthly data from January 1926 through March 2015 and breaks out 1, 3, 5, and 10 year returns based on where the CAPE ratio stood at the beginning of each month in the data set.
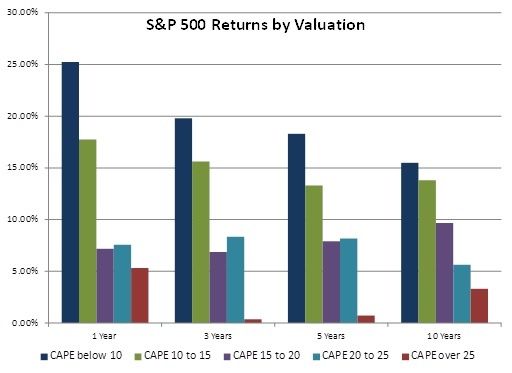
The dark blue bars represent the periods in which the CAPE started below 10, which is considered to be very cheap. The red bars represent periods in which the CAPE started above 25, which is considered to be expensive. The simple take away from comparing those two sets of data is that we generally experience lower returns when valuations are high.
The flaw with accepting the chart above as the only outcome is that the average scenarios do not capture the wide range of possibilities. The next table looks more closely at the range of returns specifically for periods following a CAPE ratio over 25, which is the situation we are in today.
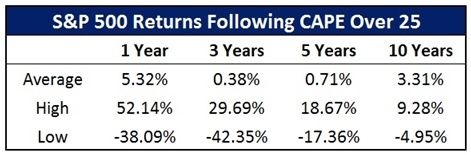
The wide range of returns – as seen by comparing the High and Lows versus the Average outcome for any given period – serves as a reminder that the market doesn’t follow a set of rules. High valuations may typically result in below average returns, but sometimes they will provide much better or much worse returns.
It is important to note that all of this data uses nominal returns, which aren’t always as relevant to the financial planning process as real returns that account for inflation. Nominal returns don’t need to be as high during periods of low inflation and low interest rates to have good financial planning outcomes.
Valuation is a terrible market timing tool – markets valuations tend to stay relatively high or low levels for extended periods of time – but they are useful in setting expectations. Current valuations suggest that stock prices are vulnerable to unexpected shocks and long-term returns have an increased probability of trailing historical average returns. Still, we expect market exposure to continue delivering higher long-term returns than fixed income, alternatives, or cash.
Rather than trying to predict short-term market movements, you will benefit more focusing on the things that you can control such as asset allocation, risk exposures, investment costs, taxes, etc.
Peter Lazaroff, CFA, CFP®
Sources and Disclosures:
CAPE data: http://www.econ.yale.edu/~shiller/data.htm
Past Performance is not a guarantee of future performance. Investing involves risk.
The S&P 500 Index is widely regarded as the best single gauge of the U.S. equities market. This world-renowned index includes a representative sample of 500 leading companies in leading industries of the U.S. economy. Although the S&P 500 Index focuses on the large-cap segment of the market, with approximately 75% coverage of U.S. equities, it is also an ideal proxy for the total market. An investor cannot invest directly in an index.
Next Steps:
If you’re ready to start making smart decisions with your money and build your wealth, take a brief financial wellness analysis and learn in just 9 questions your biggest areas of opportunities you should be focusing on in your finances.

Disclosure:
This material has been prepared for informational purposes only and should not be used as investment, tax, legal or accounting advice. All investing involves risk. Past performance is no guarantee of future results. Diversification does not ensure a profit or guarantee against a loss. You should consult your own tax, legal and accounting advisors.
This article originally appeared on Forbes.com.
-Jan-21-2026-02-09-58-9174-PM.png?width=266&name=Copy%20of%20blog%20featured%20image%20(1)-Jan-21-2026-02-09-58-9174-PM.png)

-4.png?width=266&name=Copy%20of%20blog%20featured%20image%20(1)-4.png)

