

The S&P 500 is flirting with bear market territory (defined as a 20% decline from the high) as investors grapple with several variables including multi-decade high inflation, aggressive monetary policy tightening, and persistent global supply chain issues.
Whether we are heading towards an official bear market or not, now seems like a prudent time to offer some historical context and the case for staying the course.
Losses Are Normal
Losses are completely normal – they are simply the price you pay in exchange for higher expected returns.
The table below looks at intra-year declines (red dots) and annual returns (blue bars) dating back to 1980. Drawdowns happen on an annual basis, averaging intra-year decline of 14%. And yet, annual returns finished in the black in 32 out of 42 years.
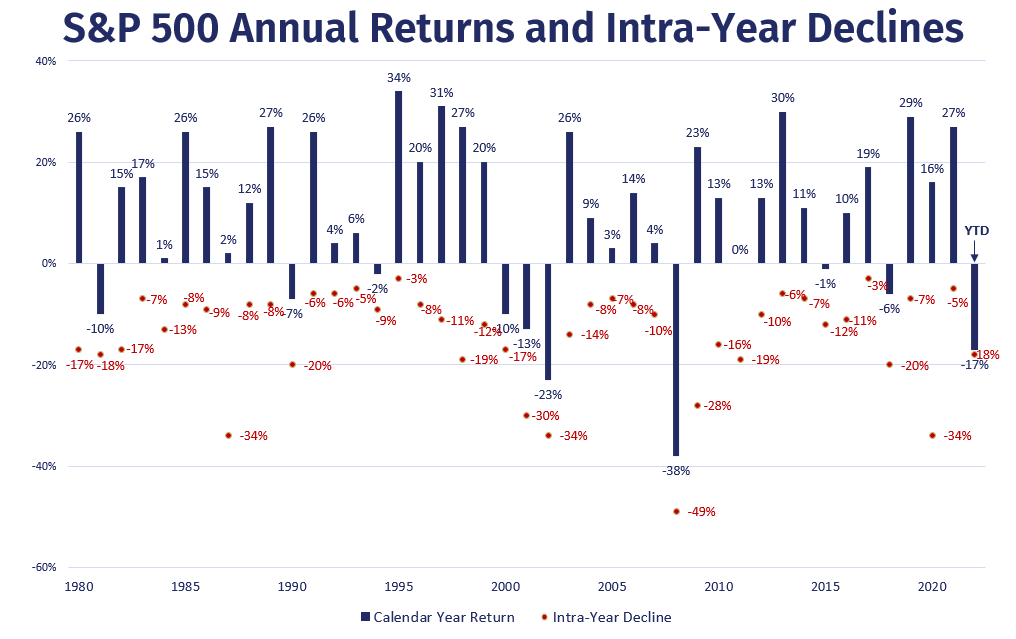
Data from Bloomberg. Indices are not available for direct investment. Index returns are not representative of actual portfolios and do not reflect costs and fees associated with an actual investment. Past performance is not a guarantee of future results. Actual returns may be lower.
Investors must be willing to lose money on occasion – sometimes a lot of money – to earn the average long-term return that attracts most people to stocks in the first place. The good news is that you can reduce the chance of loss by agreeing to stay invested over a long period of time.
Markets are highly uncertain in the short-term. But in the long-term, the range of outcomes narrows.
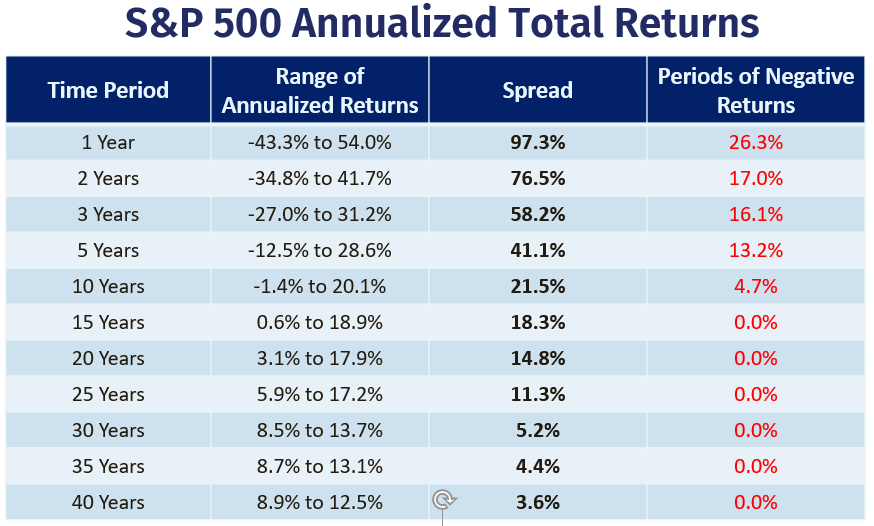
Data from Bloomberg through 12/31/2021. Indices are not available for direct investment. Index returns are not representative of actual portfolios and do not reflect costs and fees associated with an actual investment. Past performance is not a guarantee of future results. Actual returns may be lower.
I also like to show this narrowing of outcomes by comparing one-year and ten-year real returns (blue lines) to the average ten-year real return (red line) on the S&P 500. Real returns (which subtract out inflation) are what we use for making financial planning assumptions.
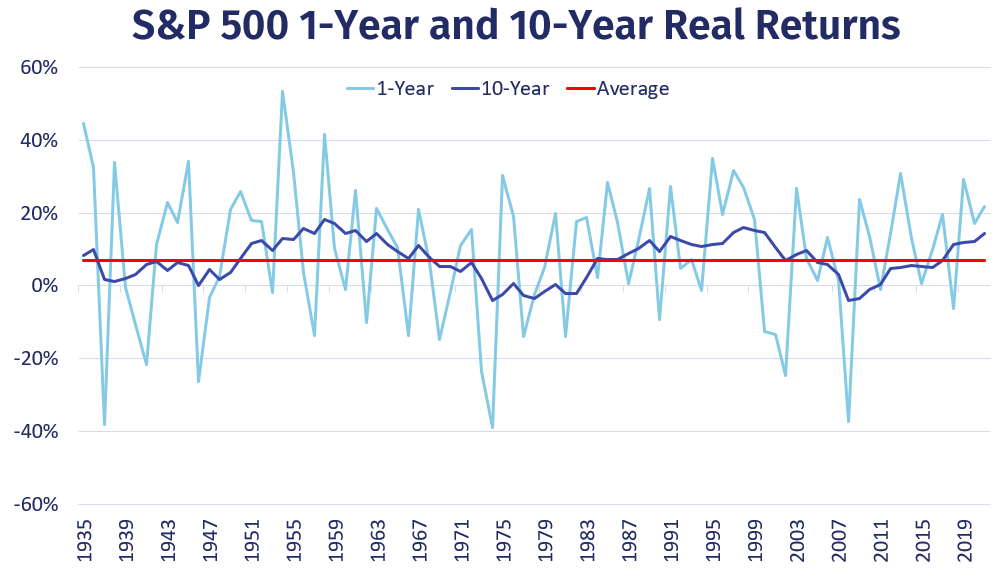
Data from Bloomberg. Indices are not available for direct investment. Index returns are not representative of actual portfolios and do not reflect costs and fees associated with an actual investment. Past performance is not a guarantee of future results. Actual returns may be lower.
Let’s also not lose sight of how good returns have been recently. The long-term average annual real return for the S&P 500 is 7.39%. From 2009-2021, the S&P 500’s average annual real return was 14.34%.
When thinking about the current market losses, remember to zoom out because your past returns count, too.
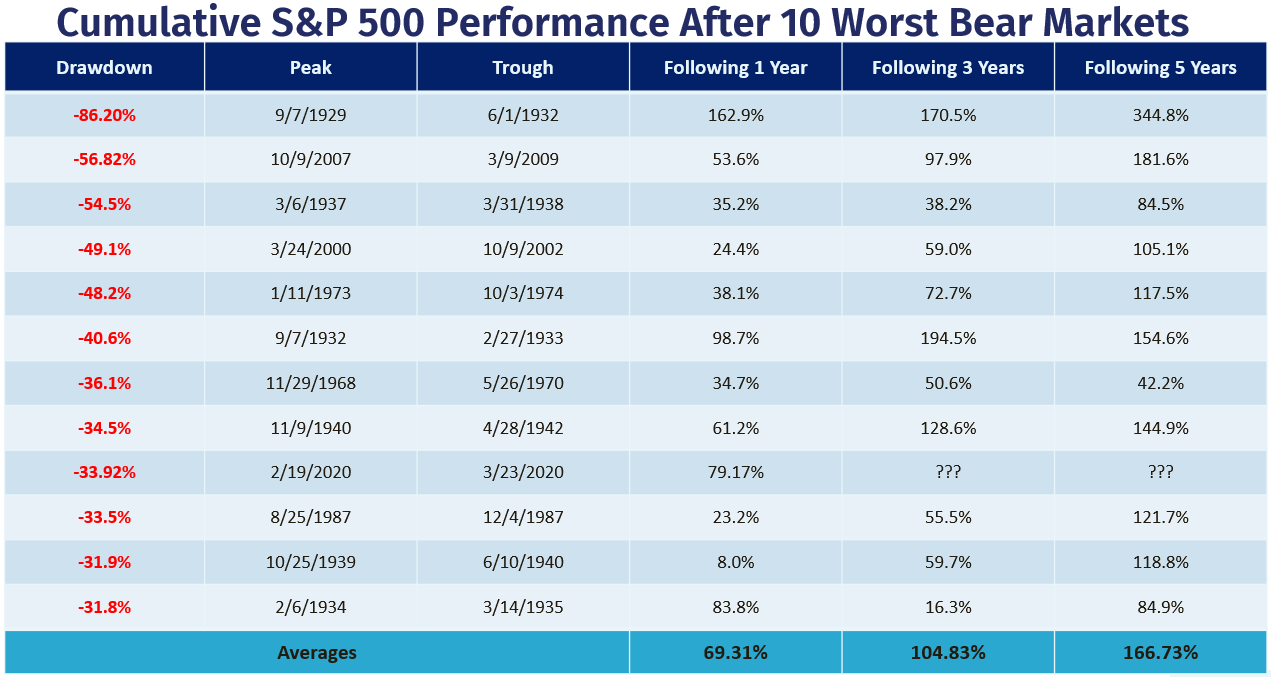
The History of Bear Markets
Below I’ve compiled bear market declines and recoveries dating since WWII, including a few instances where the drawdown narrowly missed the 20% threshold.
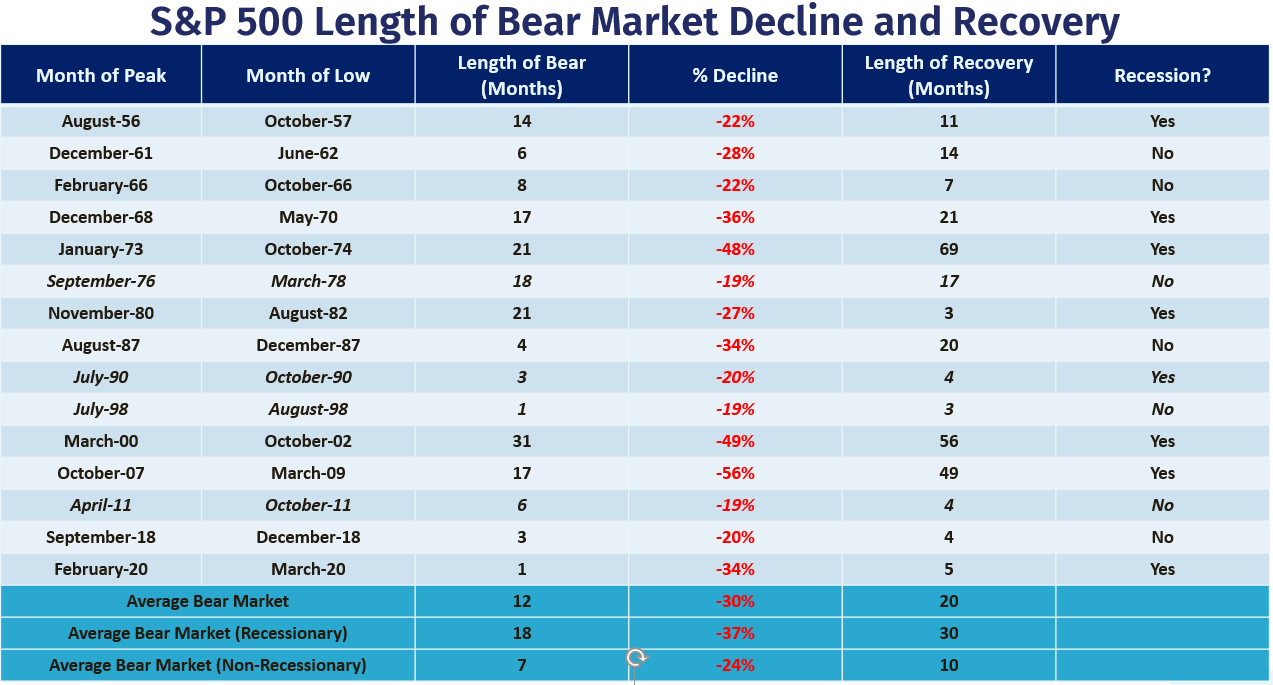
Data from Bloomberg. Indices are not available for direct investment. Index returns are not representative of actual portfolios and do not reflect costs and fees associated with an actual investment. Past performance is not a guarantee of future results. Actual returns may be lower.
As you can see, the average bear market lasts about a year and experiences a decline of 30%. There is a noticeable difference in the length of recessionary and non-recessionary bear markets declines. Similarly, non-recessionary bear markets tend to recover more quickly.
We can never know when a bear market will end, but it is worth noting that half of the S&P 500’s best days in the last 20 years occurred during a bear market. Another 34% of the market’s best days took place in the first two months of a bull market.
Suggesting that investors stay the course doesn’t mean ruling out the possibility that things might get worse, but missing those best days is far more harmful to your long-term wealth than accepting negative market returns during a downturn.
Data from Bloomberg. Indices are not available for direct investment. Index returns are not representative of actual portfolios and do not reflect costs and fees associated with an actual investment. Past performance is not a guarantee of future results. Actual returns may be lower.
If you worry too much about trying to miss the bear markets – which you can barely even see when you zoom out – you’ll miss out on the disproportionately larger gains from the bull markets.
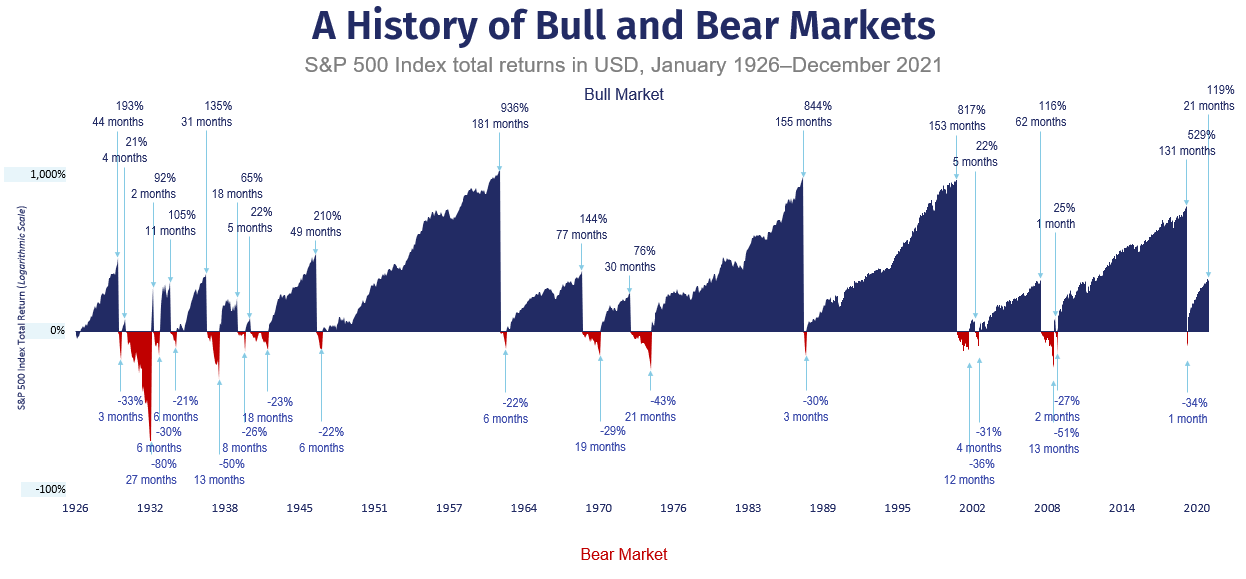
Chart from Dimensional Fund Advisors. Indices are not available for direct investment. Index returns are not representative of actual portfolios and do not reflect costs and fees associated with an actual investment. Past performance is not a guarantee of future results. Actual returns may be lower.
It’s periods like these where the market requires you to embrace fear and uncertainty in exchange for the returns you need to compound your wealth over time. Unless you need your entire portfolio to meet living expenses in the next year, the benefit of missing some of the downside is far less impactful than ensuring you capture the upside whenever it comes.
Bonds Are Losing Money...What the Heck?
The role of your fixed income holdings is to lower the overall volatility of your portfolio. As we’ve seen this year, that doesn’t mean that bonds can’t experience losses.
Bond prices fall when interest rates rise. The yield curve chart below from J.P. Morgan shows the significant rise in interest rates since the start of the year.
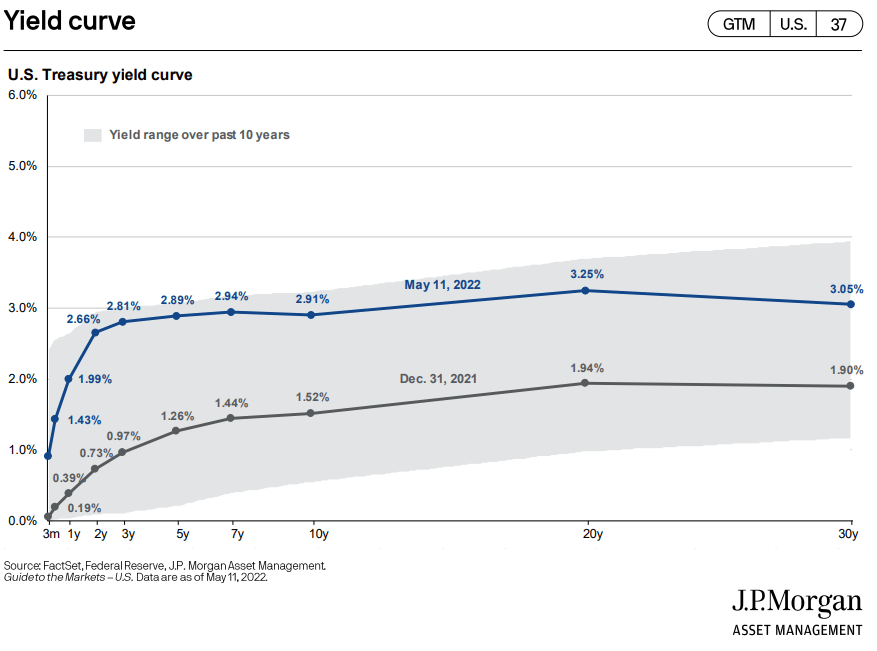
But there’s good news about increased interest rates. If your time horizon is longer than the duration of your fixed income holdings, then higher rates actually improve your overall returns.
It’s really just simple math. To see this in action, imagine that we have a bond portfolio with a yield-to-maturity of 2% and a duration of 3. The chart compares the cumulative total returns across three interest rate scenarios: no change in interest rates (gold), one percentage point increase in interest rates (dark blue), and one percentage point decrease in interest rates (light blue).
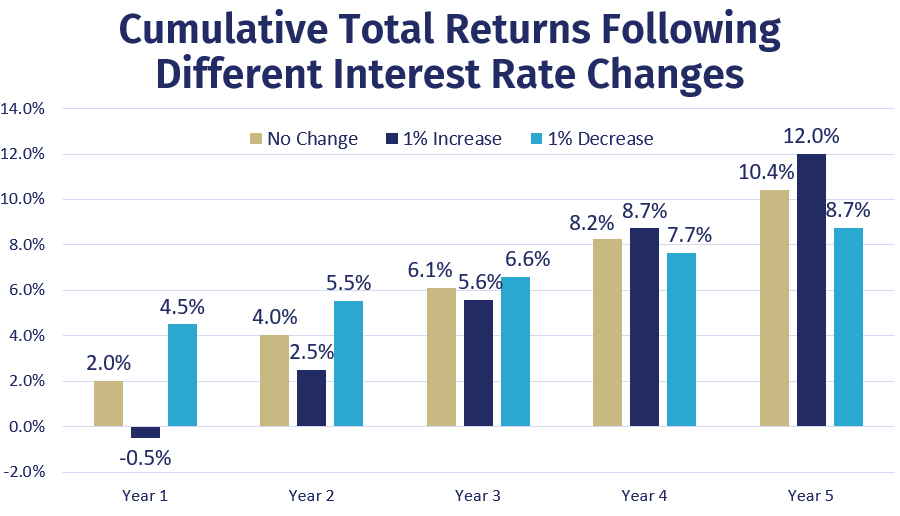
Source: Plancorp. For illustrative purposes only. Illustration assumes starting yield to maturity of 2% and duration of 3. Cumulative total returns are then displayed assuming a one-time parallel shift in yields of one percentage point and then no further fluctuations in interest rates. All interest and principal are assumed to be reinvested.
As you can see, rising interest rates hurt returns in the early years as compared to the scenario where rates fall or don’t change at all. But once your holding period extends beyond the portfolio’s duration of three years, it starts to benefit your portfolio.
Conversely, the light blue lines representing the scenario of an interest rate decrease outperforms initially but begins to hurt returns after year three.
The point is important enough that it’s worth repeating: rising interest rates are good as long as your time horizon is greater than your duration.
And even with the recent losses in bonds, that portion of the portfolio is still providing diversification benefits since the magnitude of losses is significantly less than that of stocks.
What's Next
While it’s incredibly important to stay the course with your investment plan, that doesn’t mean we need to sit idly.
Our Portfolio Management team continually looks for opportunities to rebalance and tax-loss harvest positions. Meanwhile, our Investment Committee continues to perform due diligence on the investment universe for opportunities to improve our evidence-based investment strategies.
If you’re feeling uneasy about the recent market losses, then you may consider reaching out to your Wealth Management team to review the inputs of your financial plan and perhaps even run a safety net analysis.
Finally, the information you consume is important to maintaining a long-term mindset. We hope that you will subscribe to the expanding number of ways we communicate with clients from podcasts and Alexa updates to videos and webinars.

Disclosure:
This material has been prepared for informational purposes only and should not be used as investment, tax, legal or accounting advice. All investing involves risk. Past performance is no guarantee of future results. Diversification does not ensure a profit or guarantee against a loss. You should consult your own tax, legal and accounting advisors.
Plancorp is a registered investment advisor with the Securities and Exchange Commission ("SEC") and only transacts business in states where it is properly registered or is excluded or exempted from registration requirements. SEC registration does not imply a certain level of skill or training. Please refer to our Form ADV Part 2A disclosure brochure and our Form CRS for additional information regarding the qualifications and business practices of Plancorp.


