

In the world of investing, the allure of higher returns can often overshadow the importance of prudent risk management.
One common misconception among investors is the belief that investing in a portfolio of 100% stocks, perhaps even just the S&P 500, is the fastest, most effective way to build long-term wealth. This has become more prevalent in the face of above-average inflation paired with a high-flying stock market.
Here’s what the headlines might amplify:
High inflation demands more from your investments; U.S. stocks beat their international counterparts for more than a decade; disappointing returns from bonds are a drag, the 60/40 portfolio is dead, it’s time to go all in with 100% stocks!
While it’s true that stocks have often outpaced bonds and cash over long periods of time, that’s not always the case. And there are many other factors to consider before dumping your entire life savings into an S&P 500 ETF (or wishing you had done so 30 years ago). A strategy such as this can be laden with unnecessary risks.
Here’s the reality: investments aren’t like gambling for most people. That is, your retirement savings and the investment decisions that grow them can’t absorb infinite levels of risk, and they don’t operate on a convenient timeframe.
Financial plans, and the investment portfolios that fund them, are tied to your real life, your hopes and aspirations for the future, and the things that matter most to you. They are also built upon a great deal of uncertainty, which is why a deep understanding of your willingness and ability to take risk, along with the amount of flexibility you have to pivot when things don’t go your way, should carry a great deal of weight when it comes to making investment decisions.
Just like the end of your favorite childhood cereal commercial, stocks are a part of balanced... portfolio, which is code for lacking sufficient nutritive value on their own to maintain your overall (financial) health and wellbeing.
In this article, we'll delve into the reasons why going all in on stocks makes for great click bait articles, but is likely a bad idea for most investors in practice.
Expected Market Returns
When asked what kind of returns to expect from the stock market, many investors will give an answer of 8% to 12% per year. This seems pretty reasonable, especially given the average annualized return of the S&P 500 was 10.1% from 1926-20221.
Most will concede that actual stock market returns in any given year could be much higher or lower, maybe +/- 15% in either direction, but returns should generally level out over time, right?
Compare this to cash, which struggles to keep up with inflation in the long run, bonds that were down 13% in 20222, and an international stock market that has underperformed US stocks in 8 out of the last 10 years.
If that’s all the information we have to go by, the choice seems pretty clear. Would you rather make 10% or less than 10%?
We need to dig past these headline numbers to better understand and fully appreciate the risk involved in pursuing stock market returns and how likely we may be to actually achieve them when it matters most for your personal financial plan.
Let’s start with the 10%+ number often touted. Here’s what that weighty historical context should mean: stocks are an important growth engine for any financial plan. They outperform many assets over the long-term by betting on continued economic growth over time.
That said, the average annualized return of the S&P 500 from 1928-2022 is one very specific 96-year period, making it of little use when it comes to deciding how much of your portfolio should be allocated to stocks. It’s a big leap to go from saying “stocks have been a high-performing asset class over the last 100 years” to “you should invest everything you have in stocks today.”
Risk Tolerance Considerations
Stocks are inherently volatile assets, subject to fluctuations tied to a variety of factors like corporate earnings, economic conditions, geopolitical events, interest rates, government policy, regulations, currency valuations, and investor sentiment driven by expectations for inherently unknowable future.
While this volatility can feel quite uncomfortable at times, these increased levels of risk and uncertainty are key drivers for long-term stock market returns. Put another way, risk and return are related. The opportunity to achieve higher returns requires an increase in the amount of risk you take. Being willing and able to accept and thoughtfully manage these risks is the price of admission for achieving higher expected returns with stocks as a long-term investor.
But just how volatile are we talking? What does taking on these risks actually look like?
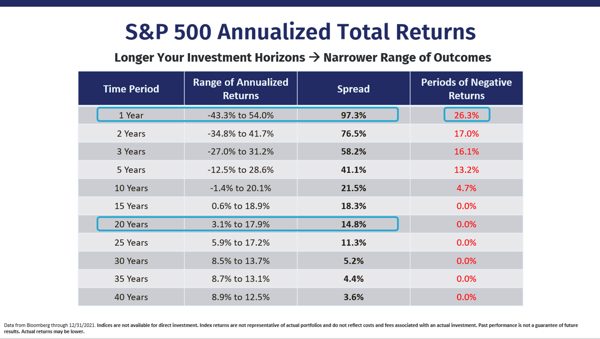
While it is true that the range of historical returns for the S&P 500 narrows as the number of years increases, you might be surprised at just how volatile returns can be in the short run and how wide the range of returns has historically remained over what many would consider to be very long periods of time.
Key Observations and Questions
1. The range of 12-month returns for the S&P 500 is -43.3% to +54.0%, generating negative returns more than 25% of the time.Your Ability to Take Risk
Multiply your total portfolio value by 0.433 to determine how much your portfolio would be down with a return of -43.3%.
- How would this decline impact your ability to live the life you want to live, both now and in the future?
- What adjustments would need to be made to you financial life and how willing would you be to make them?
- Are the financial goals funded by your portfolio able to sustain negative returns in one out of every four 12-month periods of time?
Your Willingness to Take Risk
- What actions would you consider taking to address a 43% decline? Would you be comfortable sticking with 100% stocks? Would you feel compelled to move some or all of your portfolio into bonds or cash to prevent further losses?
- How likely are you to shrug off negative returns 25% of the time as a normal part of investing? Would this create undue stress, anxiety, or frustration for you, even if you are able to stay the course?
Investment outcomes aren’t driven solely, or even primarily, by long-term average returns. The order in which you get those returns is critically important, especially as you begin taking distributions from your portfolio in retirement.
As demonstrated below, swapping out the first two years of returns with the last two years, keeping all other return and distribution assumptions the same over a 20-year period of time, leads to very different results. This phenomenon is known as sequence risk, and it’s something that a 96-year average rate of return alone does not take into account.
|
|
Scenario 1 |
Scenario 2 |
||||||
|
Year |
Starting Balance |
Distributions |
Annual Return |
Ending Balance |
Starting Balance |
Distributions |
Annual Return |
Ending Balance |
|
1 |
$5,000,000 |
-$235,000 |
22% |
$5,813,300 |
$5,000,000 |
-$235,000 |
-37% |
$3,001,950 |
|
2 |
$5,813,300 |
-$235,000 |
7% |
$5,968,781 |
$3,001,950 |
-$235,000 |
-17% |
$2,296,569 |
|
3 |
$5,968,781 |
-$235,000 |
3% |
$5,905,794 |
$2,296,569 |
-$235,000 |
3% |
$2,123,416 |
|
4 |
$5,905,794 |
-$235,000 |
12% |
$6,351,290 |
$2,123,416 |
-$235,000 |
12% |
$2,115,025 |
|
5 |
$6,351,290 |
-$235,000 |
15% |
$7,033,733 |
$2,115,025 |
-$235,000 |
15% |
$2,162,029 |
|
6 |
$7,033,733 |
-$235,000 |
-18% |
$5,574,961 |
$2,162,029 |
-$235,000 |
-18% |
$1,580,164 |
|
7 |
$5,574,961 |
-$235,000 |
42% |
$7,582,745 |
$1,580,164 |
-$235,000 |
42% |
$1,910,133 |
|
8 |
$7,582,745 |
-$235,000 |
17% |
$8,596,862 |
$1,910,133 |
-$235,000 |
17% |
$1,959,905 |
|
9 |
$8,596,862 |
-$235,000 |
9% |
$9,114,429 |
$1,959,905 |
-$235,000 |
9% |
$1,880,147 |
|
10 |
$9,114,429 |
-$235,000 |
-10% |
$7,991,486 |
$1,880,147 |
-$235,000 |
-10% |
$1,480,632 |
|
11 |
$7,991,486 |
-$235,000 |
18% |
$9,152,654 |
$1,480,632 |
-$235,000 |
18% |
$1,469,846 |
|
12 |
$9,152,654 |
-$235,000 |
27% |
$11,325,420 |
$1,469,846 |
-$235,000 |
27% |
$1,568,254 |
|
13 |
$11,325,420 |
-$235,000 |
-12% |
$9,759,570 |
$1,568,254 |
-$235,000 |
-12% |
$1,173,264 |
|
14 |
$9,759,570 |
-$235,000 |
35% |
$12,858,169 |
$1,173,264 |
-$235,000 |
35% |
$1,266,656 |
|
15 |
$12,858,169 |
-$235,000 |
2% |
$12,875,633 |
$1,266,656 |
-$235,000 |
2% |
$1,052,289 |
|
16 |
$12,875,633 |
-$235,000 |
6% |
$13,399,071 |
$1,052,289 |
-$235,000 |
6% |
$866,327 |
|
17 |
$13,399,071 |
-$235,000 |
12% |
$14,743,759 |
$866,327 |
-$235,000 |
12% |
$707,086 |
|
18 |
$14,743,759 |
-$235,000 |
15% |
$16,685,073 |
$707,086 |
-$235,000 |
15% |
$542,899 |
|
19 |
$16,685,073 |
-$235,000 |
-37% |
$10,363,546 |
$542,899 |
-$235,000 |
22% |
$375,637 |
|
20 |
$10,363,546 |
-$235,000 |
-17% |
$8,406,693 |
$375,637 |
-$235,000 |
7% |
$150,481 |
|
|
|
|
7% |
$8,406,693 |
|
|
7% |
$150,481 |
Managing sequence risk becomes critical as you move into the distribution phase of your financial plan, which is why we believe using straight-line return assumptions in your financial plan (like 7% per year) is relatively unhelpful.
Shortfalls of a 100% Stock Portfolio
Lack of Diversification:
Diversification is a fundamental principle of risk management in investing. By spreading your investments across different asset classes, industries, and geographic regions, you can reduce the impact of negative events affecting any single investment to maintain a somewhat predictable level of growth to fuel your personal goals.
“But I’m investing in the S&P 500, isn’t that diversified?” In short, no. At the beginning of 2024, nearly 30% of the S&P 500 index is allocated to 6 tech companies. By investing solely in the S&P 500, you're excluding small- and mid-cap stocks, international stocks (which make up 45% of the global stock market), bonds, and all of the diversification benefits that come with them.
Emotional Rollercoaster:
Investing exclusively in stocks can subject you to unnecessary stress and anxiety, particularly during periods of market turbulence. Constantly monitoring your portfolio's performance and reacting impulsively to market movements can lead to emotional decision-making, such as panic selling during downturns or chasing returns during bull markets.
A well-diversified portfolio, on the other hand, provides a buffer against emotional extremes, making it easier to maintain a disciplined approach to investing that focuses on the long-term goals you are trying to fund.
Inadequate Risk-Adjusted Returns:
While stocks have the potential to deliver high returns over the long term, the pursuit of maximum returns without considering risk can result in suboptimal outcomes.
Academic research and empirical evidence consistently demonstrate that a diversified portfolio comprising a mix of asset classes tends to provide superior risk-adjusted returns compared to an all-equity portfolio. Put another way, they offer a better bang for your (risk) buck.
By incorporating assets with low correlations to stocks, you can enhance portfolio efficiency and achieve a more favorable risk-return profile.
Neglecting Investment Objectives and Time Horizon:
Successful investing is not solely about maximizing returns; it's also about aligning your investment strategy with your financial goals, risk tolerance, and time horizon.
A strategy of investing 100% of your portfolio in stocks may not be suitable for everyone, particularly for investors that are risk averse and/or taking distributions from their portfolio. Failing to consider these factors can lead to mismatched expectations, disappointment, and potentially devastating financial setbacks.
Lastly, if an all-stock portfolio still sounds appealing, consider that the basis on which these claims are made with assumptions that are often detached from reality.
For example, if you had put $100,000 into a 100% stock portfolio and $100,000 into a globally diversified portfolio of 60% stocks / 40% bonds on January 1, 2004, the all-stock portfolio would have finished 120% higher twenty years on. But this assumes no changes were made to the portfolio, whether from temporarily changing your allocation or strategy, moving to cash, or even simply selling stocks to fund distributions for living expenses. Is this in alignment with your (or anybody’s) investment experience since 2004?
The Bottom Line
While stocks play a crucial role in a well-diversified investment portfolio, putting all your money into equities is a risky proposition fraught with potential perils. Articles purporting overly simplistic strategies for all investors lack even a basic understanding of your unique situation, let alone a comprehensive financial plan co-authored by a team of advisors with your best interests at heart.
If you’d like to dig in on how an evidence-based investment strategy can be used to underwrite your own financial future with a Wealth Manager at Plancorp, take our complimentary 2-minute financial plan analysis. You can gut check whether you’re on track and get curated insights specific to your plan delivered straight to your inbox.
Curious to hear more about a long-term investing mindset? Check out our Chief Investment Officer’s podcast, The Long Term Investor. Peter has over 100 episodes of rich content featuring guests like Morgan Housel and key thought leaders from the Plancorp team.
1 Dimensional Matrix Book 2023, Historical Returns Data - US, S&P 500 Index Returns, 1926 - 2022, Page 14
2 Dimensional Matrix Book 2023, Historical Returns Data - US, Bloomberg U.S. Aggregate Bond Index Returns, 2022, Page 11


