

Last week’s volatility was higher than a typical week in the market, but it wasn’t all that unusual from a historical standpoint.
Perhaps it felt scarier because 2017 was extremely unusual in that there was essentially no volatility.
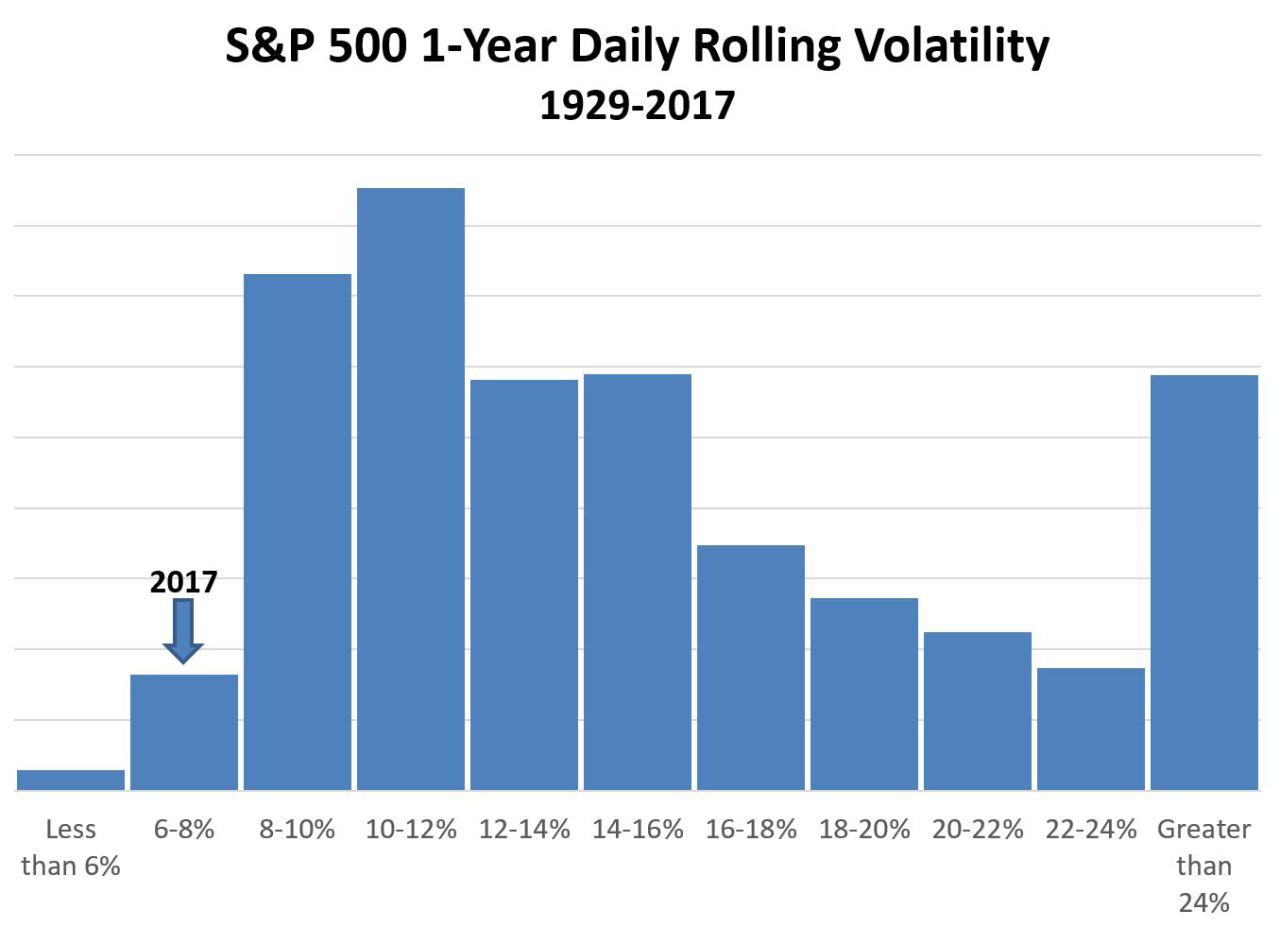
The chart below groups volatility of the S&P 500 for all rolling one-year periods going back to 1929. Annualized volatility in 2017 was just 6.68%, well below the historical average of 16.37% and inside the 1st percentile of the full data set.
But most people don’t think in terms of annual volatility. What really gets people worked up are big daily price moves.
Examining Daily Price Movements in the S&P 500
In 2017, the average daily change in price for the S&P 500 Index was just 0.30%, the second lowest of all calendar years dating back to 1929. For visual perspective, the chart below shows the average daily price change in the S&P 500 for each calendar year since 1970.
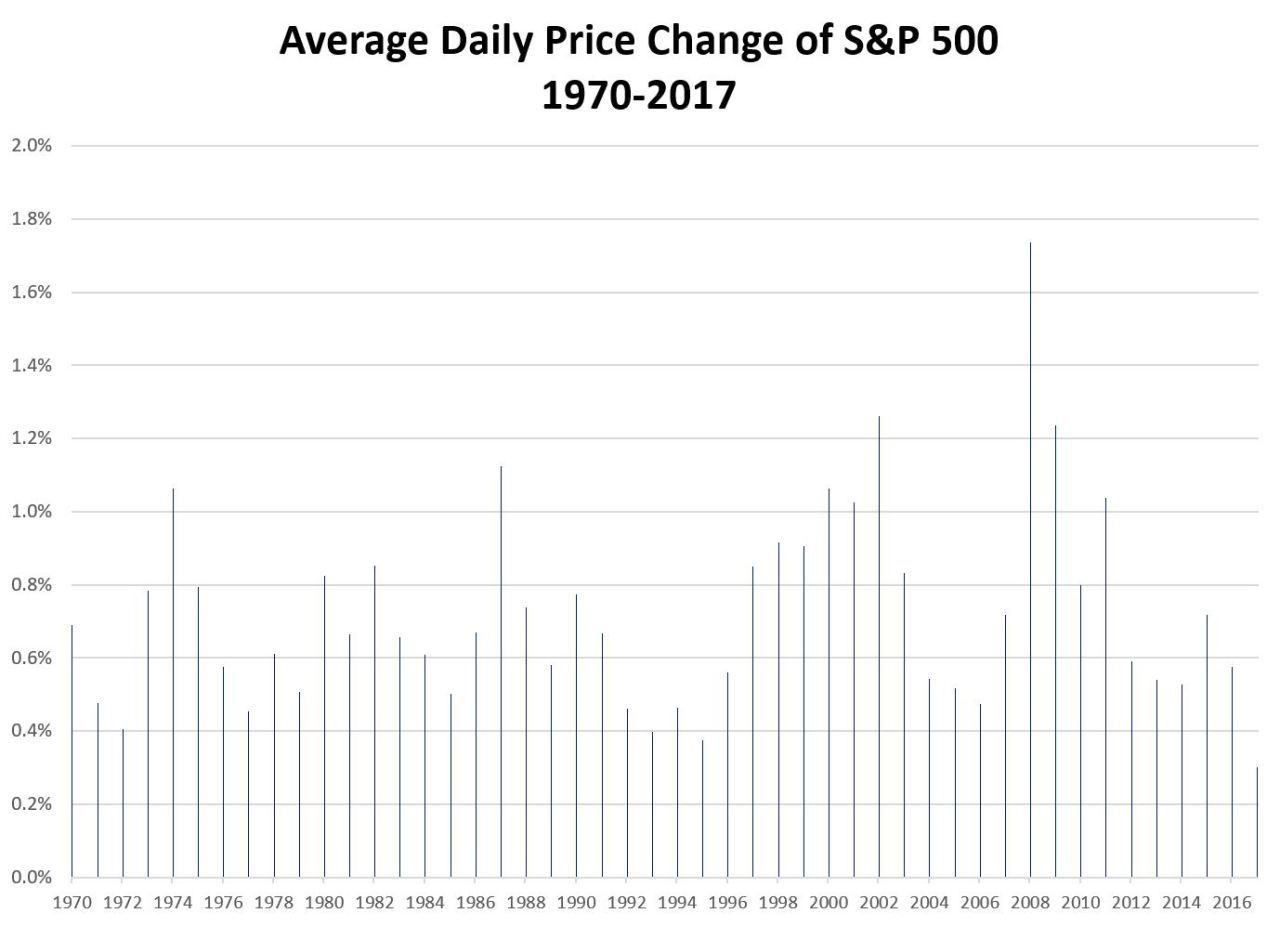
Here are a few other things that stand out in the daily price change data:
- The average daily price change in the S&P 500 from 1929 through 2017 has been 0.75%. So, the average daily market performance has been +/- 0.75%.
- The average daily change in 2017 was 0.30%. The only lower calendar year was 1964.
- We have experienced below average daily price changes since the beginning of 2012, with an average daily change of 0.54%.
- The average daily change so far in 2018 has been slightly above average at 0.86%.
- The average daily change last week was 2.32%.
- The last time we had similar daily price swings was in August 2011 amidst a 16.77% decline in the S&P 500 over a ten-day period. The big headlines at the time were Standard & Poor’s downgrading U.S. Treasury debt and Europe dealing with credit crisis contagion.
- The average daily price change throughout the Financial Crisis (from the October 9, 2007 market top to the March 9, 2009 market bottom) was 1.63%.
- The average daily price change during the Financial Crisis peaked at 2.83% during the period between September 15, 2008 and March 9, 2009.
The above information provides some historical context. While last week’s volatility was certainly higher than a typical week in the market, it wasn’t unusual from a historical standpoint.
How long will the volatility persist?
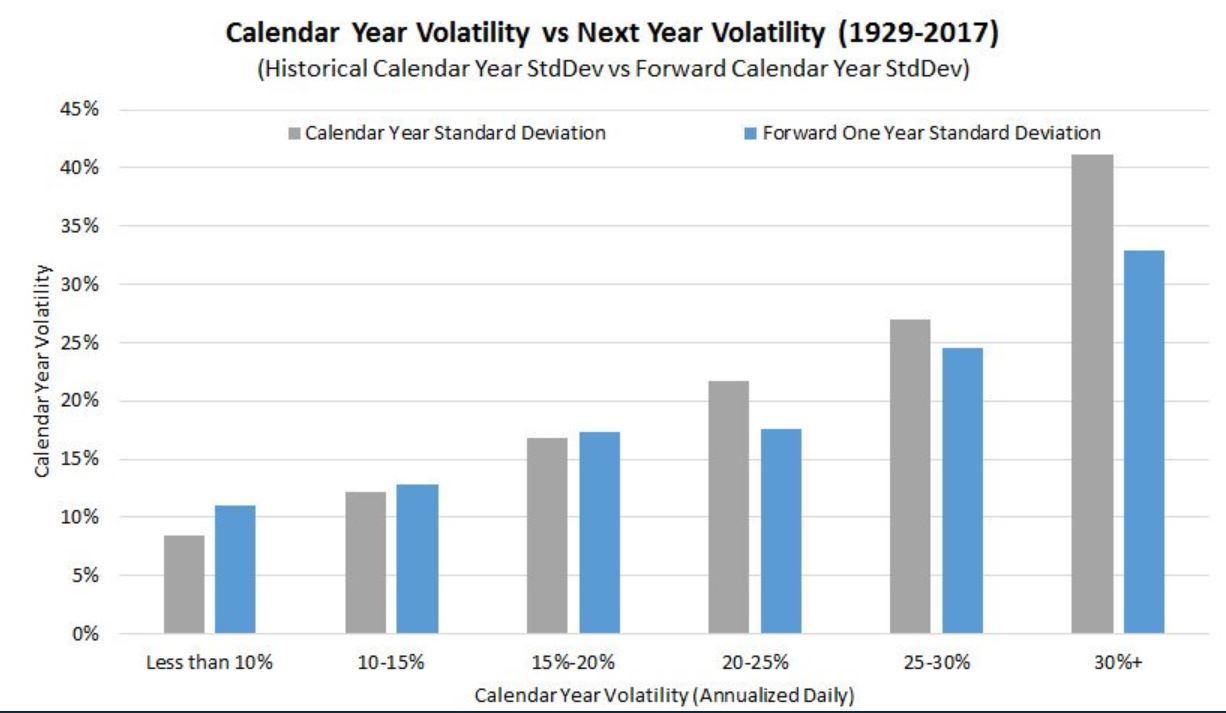
Volatility tends to be sticky – years of higher than average volatility are generally followed by another year of above average volatility. The same applies to years with low annual volatility. The relationship weakens, however, when you shorten the time periods to weeks or months.
Jake from EconomPic did a nice job of showing calendar year volatility using the same data set (the Tweet that led to me giving Jake the data is at the bottom of this post).
In short, nobody knows when the recent bout of volatility will subside. My best advice is to stop looking at your portfolio and simplify your investments by focusing on things that you can actually control.